 This paper introduces vulnerability as an important parameter for decision-support in cost-benefit analyses for transportation projects, by seeking to establish a link between the terms reliability and vulnerability vis-à-vis costs and benefits. The paper contends that a reliable transportation network represents a net benefit to society, and conversely, that a vulnerable network represents a net cost to society. Vulnerability costs or disruption costs are related to both location on and usage of the transportation network, and methods to explore these costs are suggested.
Husdal, J. (2007) Cost-Benefit Analysis – an essay about valuation problems. Unpublished working paper. Molde University College, Molde, Norway. Available at https://husdal.com/2007/01/05/cost-benefit-analysis-an-essay-about-valuation-problems/ Last accessed on [date].
Introduction
Cost-benefit analysis (CBA), in essence, is a tool for decision making. It can be applied to almost any kind of decision in any kind of field. In its most pure form, a CBA will aggregate the pros and cons (positive and negative effects) of a proposal, and, if the pros (benefits) outweigh the cons (costs), the proposal is viable. Usually, the analyst will assign monetary values to each of the costs and benefits, hence making the analysis easier to calculate, even if the cost and benefits per se are intangible, and thus, not directly expressible in money values. Problems often arise in how to assess the monetary values of both tangible and intangible effects, which may lead to skewed and biased results. One of the reasons for this is that most cost-benefit analyses are done so-called ex ante, before a project or proposal or policy is carried out or implemented.
The use of cost benefit analysis in the transportation sector
Cost-benefit analyses are widely used within the transportation sector. Albeit seemingly a new technique, one of the first to actually apply CBA was Dupuit, in France, in 1844, in his classic paper on the utility of public works (Prest, 1965). Since then, CBA has emerged as one of the most-used tools in deciding the viability of proposed infrastructure projects. A full CBA not only assesses the immediate impact and immediate costs and benefits (primary market effects), but also takes into account all externalities that are affected by said project (secondary market effects). Dupuit was also the first to introduce the concept of consumer surplus, a key element in economic welfare theory. Consumer surplus is defined as the difference between the maximum amount that an individual would be willing to pay for a good and the actual amount paid. On a standard supply and demand diagram, see below (taken from Wikipedia), consumer surplus is the triangle above the price and below the demand curve. These consumers are paying less for a good than the maximum that they would pay. Producer surplus shows up as a triangle below the price and above the supply curve, since that is the minimum price that a producer can produce that quantity with and still make a profit.
 Consumer surplusCombined, consumer surplus and producer surplus make up what is called social surplus, and a cost-benefit analysis seeks to identify the social surplus of the particular project that is subject to analysis. A cost-benefit analysis proceeds in four essential steps: (a) identification of relevant costs and benefits, (b) measurement of costs and benefits, (c) comparison of cost and benefit streams accruing during the lifetime of a project, and (d) project selection. (Nas, 1996). In the first phase, all related costs and benefits are identified. The second stage then, entails valuing and pricing of both tangibles and intangibles. In the third phase, the present value of future benefits and costs must be calculated, and finally, projects are ranked according to some criteria, most often cost-benefit ratio and net present value. However, choosing which project to go forward with may not be straightforward. Sometimes, external effects may play a part in the final decision, and often there will also be a political or regional agenda that needs to be satisfied.
In Norway, the Planning and Building Act requires the use of an environmental impact analysis for all major development projects. Albeit named “impact analysis”, in essence it is a full CBA, assessing both tangible and less tangible effects (Statens Vegvesen, 2006).
Reliability and vulnerability = benefit and cost?
One issue of major concern in the transportation sector, which has gained interest recently, is the reliability of infrastructure systems. Road transportation is no exception, since road networks are the main backbone of modern society. Consequently, the reliability, or conversely, the vulnerability of any transportation network is thus a decisive factor not only in terms of market outreach and competition, but also in terms of continuity, to ensure a 24/7 operation of the community we live in. Any threat to the reliability of the transportation network constitutes a vulnerable spot, a weakness. This is of particular concern when considering sparse, rural networks, because what by urban standards is a minor degradation (i.e. car accident, resulting in queuing, delays and diversions) may have severe consequences if occurring in a rural setting (i.e. blocking the only access road for hours).
In the most common manner of speaking, the reliability of a transportation network can be defined as the probability that one or more of its links functions, or rather: does not fail to function, according to a set standard of operating variables. A non-functioning, or at best, badly-functioning link will impose costs on the user in terms of loss of time, additional operation costs or other costs as a result of delays and diversions. Transporters of perishable goods will also experience a loss of value. Few will question that the sender, the recipient, the freight hauler, or society at large, experience additional costs when goods or people cannot reach their destinations in time or in space (Husdal, 2004).
The increase in just-in-time (JIT) manufacturing operations has made a reliable travel time an important economic factor. JIT relies on the transportation system to take advantage of lowcost labor and manufacturing plant development costs. Producing components in several manufacturing plants and bringing them together in one location at the same time to produce the final product can reduce inventory requirements and total costs, but requires a controlled environment for travel times. If one component does not arrive due to improper product scheduling or due to traffic delays, an assembly line can be shut down, or costly building space has to be used for inventory storage, rather than for manufacturing or assembly operations (Lomax, 2003). Consequently, it should be obvious that a reliable transportation network represents a benefit to society. Equally, a vulnerable network would represent a net cost to society. These are socio-economic costs that should be taken into consideration in cost-benefit analyses of transportation projects; yet, as a norm, reliability and vulnerability are not evaluated in today’s practice (RISIT, 2004). This means that the evaluation of benefits of proposed new projects and the costs of using existing infrastructure may be lacking important elements.
In terms of road user utility new projects are generally considered as improvements, the same normally applies to reliability. It is often taken for granted that road improvements that alleviate congestion and travel time variability also improve reliability. What remains an open-ended question is whether new projects also bring with them a lesser vulnerability. Exchanging one kind of vulnerability for the other, while supposedly increasing reliability, may in terms of socio-economic impact not be the best solution.
A system approach that takes both sides into account is thus necessary. The reason is straightforward: to evaluate the cost of remaining vulnerable against the assumed benefit of becoming less vulnerable with the proposed project. Vulnerability, represented by the consequential costs of an operational degradation, is a cost that should be included in a cost-benefit analysis. Likewise, reliability, representing the consequential benefits of an operational improvement, is a benefit value, which too needs to be included (Husdal, 2005).
Example 1: A project is proposed to reduce the consequences of avalanches on a selected link on a given route, being one route of several alternative routes between a given origin and destination. This reduces the particular vulnerability of this link on this route. This improvement may cause motorists to transfer to this route from the alternative routes. If some remaining vulnerabilities on other (non-improved) links along the now partially improved route are neglected and left unattended, then this may in turn affect a larger number of road users then before the particular improvement.
Example 2: Typical Norwegian issues of vulnerable links are ferry crossings, with a high probability of frequent closures and delays, often being the only access to a given community or between major regions. These crossings are in some cases replaced by sub sea tunnels, with practically no probability of any closure, and are hence considered a considerable improvement in reliability. Normally, after the tunnel is built, the ferry jetties are dismantled. If the tunnel is then closed due to an accident, say, a fire, and remains closed for a long period of time, this community would in fact be more vulnerable after the project then before. Disruptions in a road network are often the result of external influences such as landslides, avalanches or rock fall, flooding, lack of snow clearing during winter, accidents that require extensive clean-up, etc.; the list of scenarios is literally endless. Intentional sabotage or terrorist attacks must also be included here, but are not a major scope of this paper. Often seen in Norway, closures of sub sea tunnels and failures or severe degradation of ferry services are also among the many factors that will occur depending on the season and location. Ferry services may be of no concern in some parts of the country, whereas rock fall can be a major issue in other parts.
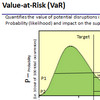
Figure 2 below, taken from Husdal (2005), is a good illustration of the relationship of cost-benefit and vulnerability versus reliability: The disruptions costs, and thus vulnerability, increase from right to left (solid line), the cost of countermeasures to overcome potential disruptions, and hence the assumed reliability, increase from left to right (dotted line).

Example 3: To keep a mountain road open during winter one may consider improving the road by building a tunnel, more snow sheds, or aligning the road differently to alleviate weather exposure, or alternatively, invest in better snow-clearing equipment and increase clearing frequency. Today’s situation is (A), with high disruption costs. Building a new road and/or a tunnel is costly (B), but the probability of disruptions is lessened considerably and the disruption costs are almost negligible. Better snow-clearing equipment (C) reduces the susceptibility to disruptions somewhat – the road is still exposed to severe weather conditions – but the investment costs are much lower than in the former alternative. Consider which alternative is the most beneficial to society if investment costs and saved disruption cost are weighed against each other? Note point (D) where the two curves intersect. The expected cost of disruptions (or the expected benefits of avoiding disruptions) is there equal to the cost of countermeasures. D is the socio-economically optimal level of expected disruption costs (and the optimal expenditure on countermeasures). A movement towards D from the left means that it will be cost-effective to implement a countermeasure. A movement from D to the right means that society will be better off “living with the vulnerability”. In this particular case, better snow-clearing equipment will be a good countermeasure, a new road/tunnel will not. The individual road user may of course disagree here, but from an overall cost-benefit perspective it is correct.
If interpreting the curves in figure 2 in an economic setting, it could be said that the marginal cost of disruptions initially will fall sharply while the marginal cost of countermeasures will only rise slightly. The more countermeasures that are put in place, the less extra benefit is achieved for each marginal investment in reliability. This is in line with the traditional way of thinking in contingency planning, that it often only takes small changes or investments to make a considerable impact. Full and 100% reliability however is very costly, due to the unpredictable manner of the potential disruptions. From a strictly economical point of view, the cost of increasing the reliability should not exceed the cost of vulnerability for society to experience a benefit. What is apparent is that it may be straightforward to quantify the investment costs associated with an effort to increase reliability, the costs of disruptions are much harder to quantify in measurable terms, albeit it can be done.
Another way to look at this figure is to see the two graphs as supply/demand curves, where the cost of countermeasures corresponds to the cost of supplying a certain level of reliability. The cost of vulnerabilities can be seen as demand for the level of reliability represented by the countermeasure curve.
Valuation of reliability and vulnerability
If we see reliability as a benefit and vulnerability as a cost, a valuation of reliability and vulnerability would then entail weighing the costs of disruptions against the cost of avoiding these disruptions. Going back to the illustration of JIT in chapter 3, a transportation-dependent manufacturer will seek to either establish measures to counter disruptions that occur, or simply be willing to bear the additional costs that a disruption may cause. If a manufacturer is dependent on ontime his input materials, he may choose to heighten his input inventory, just in case his supply is cut off. If on-time delivery of his output is the issue, a manufacturer may choose to produce multiple sets of the same product, which could be shipped using different routes or modes of transportation, in case one route is cut off, or he might give his customers a rebate for deliveries that are delayed. The costs of these measures are, naturally enough, would have to be passed on to the customers.
The customers then face a similar dilemma, should one be willing to pay the extra premium for on-time delivery with one manufacturer or choose a competitor with a lower price and bear the cost of a possible delayed delivery? The economic implications are clear, but do these problems actually constitute a socioeconomic cost, or is it just a transfer of costs and benefits? If one manufacturer looses a contract because he cannot deliver on time, while another one, who would not have gotten a contract in the first place, gains said contract, for society as a whole that makes no difference. It could, however, have an impact on the regional economy, i.e. the secondary market.
Furthermore, since transportation networks, e.g. roads are supplied by the government, if disruption losses are directly inferable from a lack of adequate road structures, and that is in fact more often than not the case, then the benefits of reliability and the costs of vulnerability indeed are issues that need to be addressed for the society as a whole. Having come this far, and subscribing to the view that investments in reliability constitute a cost and saved disruption costs constitute a benefit, now remains the issue of finding the measure that best expresses these costs and benefits in monetary values.
Usually, generalized travel cost is the driving factor in cost-benefit analyses in the transportation sector. In this particular setting, savings in disruption costs correspond to savings in additional travel costs that occur as a result of detours, delays and/or closures. Normally, these costs should be easy and straightforward to calculate. An example of how this can be done on a large scale can be found in Jenelius et al. (2006). Here, the importance and exposure to disruption of each road link in the road network in Northern Sweden is characterized by how the particular link contributes to the increase in travel time, and hence travel cost, for all origin-destination (O-D) pairs within the network. For a given O-D pair it is then possible to calculate the potential vulnerability cost of travelling origin and destination should a given link in the network fail. The cost of improving reliability is not so straightforward to calculate, since that will depend on the nature of the disruption and how it best can be alleviated. Nonethesless, using Jelenius’ methodology it is possible to find (a) the vulnerability cost of using a particular route (or link on a route) in a transportation network and also (b) the vulnerability cost of location in relation to the neighbouring transportation network.
One application that comes to this author’s mind is avalanche and rock fall protection. In the mid-nineties (to be updated this year) the Norwegian Public Roads Administration surveyed “all” potential hazard sites in the region of Møre og Romsdal, registering frequency of occurrences and past closure times and suggesting abatements, including how much these would cost. However, the work stopped here, most likely since although the cost-benefit ratio for each site could be calculated, ranking the sites in a sensible manner may have proven too difficult, not to mention probable budget constraints. In this case, one could have used Jenelius et al. (1996) to calculate the disruption costs for all O-D pairs, combine this with the probability of failure and the duration thereof, and then matched with the sum of the abatement costs for all O-D pairs to suggest where to focus the abatement efforts, by finding the sites with the overall highest benefit/cost-ratio.
Generalized travel cost or saved travel time, or more specific, the value of saved travel time is normally found by using contingent value (CV) studies, in which respondents are asked how much they would be willing to pay (WTP) for a certain gain in travel time, or how much they would be willing to pay to accept (WTA) a certain increase in travel time. It should be noted though that the willingness to pay for a certain gain often does not corresponds to the willingness to accept the same amount of loss (Coursey 1987), in that the willingness to accept, or compensation demanded, often far exceeds the price one is willing to pay for a gain of the same size as the loss. What this means is that people tend to underperceive the value of losses and overperceive the value of gains. Nevertheless, CV studies have an important place in assessing the value of costs (compensation demanded) and benefits (gain received). Within the realm of reliability and vulnerability in the transportation sector it thus should be investigated in what manner transport-dependent entities adapt to transport-related uncertainties, and (a) what cost they choose to bear for this adaptation (which is essentially their WTA), and (b) what price they would be willing to pay (their WTP) to save these costs.
Conclusion
Reliability and vulnerability are important elements in ensuring a smooth 24/7 operation of transportation networks, road networks in particular, and cost-benefit analyses of transportation projects should take this into account. One way of doing this is to say that investments in improved reliability constitute a cost and thereby saved disruption costs constitute a benefit. To make a project viable in a cost-benefit sense the net present value should be positive. In this case: the present value of future disruption costs should outweigh the presently needed investment to achieve the future return. Both gains and losses in travel cost and investment cost need to be assessed carefully, but if done properly, it should be possible to develop a vulnerability index for a road network that is able to assign to both usage of and location on a particular part of the network.
References
1. Boardman, A.E. et al., 2006, Cost-benefit analysis: concepts and practice, Pearson Prentice Hall
2. Coursey, D. L. et al., 1987, The Disparity Between Willingness to Accept and Willingness to Pay -Measures of Value, The Quarterly Journal of Economics, Vol. 102, No. 3, pp. 679-690
3. Husdal, J., 2004, Pålitelighet og sårbarhet – et ikke-tema i nyttekostanalyser? Samferdsel 2/2004, s. 28-30. Reliability and vulnerability – a non-issue in cost-benefit analyses? Samferdsel (Journal of the Norwegian Institute for Transport Economics, TØI), 2/2004, pp. 28-30
4. Husdal, J, 2005, The vulnerability of road networks in a cost-benefit perspective. Proceedings of the the Transportation Research Board Annual Meeting 2005, Washington DC, USA, 9-13 January 2005
5. Jenelius, E. et al., 2006, Importance and exposure in road network vulnerability analysis, Transportation Research Part A: Policy and Practice, Vo. 40, Iss. 7, pp. 537-560
6. Lomax, T., et al., 2003, Selecting Travel Reliability Measures, Texas Transportation Institute and Cambridge Systematics Inc.
7. Prest, A. R., Turvey, R., 1965, Cost-Benefit Analysis: A Survey, The Economic Journal, Vol. 75, No. 300, pp. 683-735
8. Nas, T.F., 1996, Cost-benefit analysis: Theory and application, Sage publications
9. RISIT, 2004, RISIT – Risk and safety in the transport sector – A state-of-the-art review of current knowledge. White paper. The Research Council of Norway.
10. Statens vegvesen, (2006) Konsekvensanalyser: Del 1, Prinsipper og metodegrunnlag. Håndbok 140. Vegdirektoratet. (Norwegian Public Roads Administration (2006) Impact analysis: Principles and methodology. Handbook 140. Oslo, Norway.)