 Traditionally, in studying the effect of hazards on roads, a hazard map is prepared based on the hazard in question, the contributing factors and then overlaid with a road map. If the road or a buffer around its vicinity intersects hazard areas, these areas constitute a potential threat. In the approach used in this procedure, imagine traveling along the road and looking to either side for hazards. The neighborhood that needs to be examined is dependent on the hazard and its contributing factors. This neighborhood search then produces a hazard map that is directly related to the road.
JavalancheTM
an application for analyzing hazards next to roads
Jan Husdal, University of Utah, 2002.
View the Javadoc documentation here
Introduction
Java was chosen as programming environment not only because of the author’s familiarity with this particular programming language, but also because it allowed for quick conversion of the analysis methodology into programming steps and because it would allow for a later extension of the application within a Windows or GUI framework. In essence, this is a standalone application, albeit it has the potential for interfacing with a commercially available GIS. The application is designed for input/output from/to raster GIS. In this case, MFworks was used as the chosen GIS software for output and illustration. The application imports a raster surface as a tab-delimited text file, applies the analysis methods, and exports raster surface as a tab-delimited text file for import into a raster GIS for visualization of the result. This application was designed in a typical bottom-up manner, yet still trying to preserve a top-down perspective by allowing for future improvements and additions.
Purpose of application
Background for developing application
The purpose of this application is assisting in analyzing the threat of natural hazards to roads.
Traditionally, in studying the effect of hazards on roads, a hazard map is prepared based on the hazard in question, the contributing factors and then overlaid with a road map. If the road or a buffer around its vicinity intersects hazard areas, these areas constitute a potential threat.
In the approach used in this procedure, imagine traveling along the road and looking to either side for hazards. The neighborhood that needs to be examined is dependent on the hazard and its contributing factors. This neighborhood search then produces a hazard map that is directly related to the road.
The main conceptual difference with this approach as opposed to the overlay method is the use of a variable-shaped hazard neighborhood that is a function of location along the road. A traditional buffer is a fixed neighborhood, whereas this buffer is dependent on both hazard and location. A fixed neighborhood can be really unsatisfying in some cases because it might look too far and thus overestimate the hazard threat or simply not look far enough and thus miss some actual hazards.
The application to be developed should thus be general enough that it with simple steps can incorporate a number of natural hazards, all based on the neighborhood search approach. Currently the application is built for analyzing avalanche-prone terrain near a road. However, the application is structured such that other hazards can be analyzed without totally redesigning the application, videlicet by just adding another module.
Using the application for analyzing avalanche threat
The procedure for finding the potential for avalanche hazard to a given road segment is based on the assumption that snow, similar to water, will choose the path of least resistance from its initial starting point above the road, and then slide towards the road. Thus, the presence of avalanche terrain within a watershed, or basin, adjacent to a road segment can serve as an indicator for the avalanche threat pertaining to that road segment.
In short, the generic description of the procedure is as follows: With the road or buffer line being a line of neighboring individual cells,
For every cell along the road, determine all upstream cells that make out a basin adjacent to the road line itself or a buffer at a certain distance form the road.
For every basin, determine the “amount” of avalanche threat based on slope, vegetation and other contributing factors within the basin.
For every basin, determine the stretch of road it affects.
For every affected stretch of road, determine the threat potential based on the “amount” of threat in the basin that is linked to this particular stretch of road.
Usage
The application was put to use, together with MFWorks as the GIS software, for developing a spatial framework for analyzing hazards to transportation lifelines. The result was presented at AAG 2002.
Conceptual workflow within the application
Input
The following input is required as tab or comma delimited text files:
1) DEM surface,
2) slope surface *
3) road line or buffer edge, and
4) non-vegetated areas.
* The slope surface can easily be derived within the application, but is in this case found via commercially available GIS.
Bear in mind that every cell in the surface is assigned a unique identifier. By our convention, this is done by counting from top left to bottom right, row by row, with 1 as the first cell ID. This cell ID makes it easy to relate cell positions in different surfaces to each other.
Step by step
The text files are read into the application and converted to Raster objects, on which the analysis is conducted.
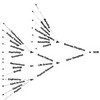
First, derive the flow direction from DEM. The flow direction follows the convention of Tomlin’s directional identifiers and this information is later used in delineating the upstream basins adjacent to the road line/ buffer edge.
A unique ID identifies each road/ buffer cell. Being the presumably lowest cell within a potential basin, this unique cell ID also denotes the basin ID for the basin adjacent to this particular road/buffer cell.
Derive the upstream basin for every road/buffer, starting with the lowest cells within the road or the buffer and working your way up the hill. Every cell in the basin is identified by its unique cell ID. Now, every cell in every basin is known. The basin ID coincides with the cell ID of the road/buffer cell it is adjacent to. The basin cells cell ID makes it possible to link every basin cell or other properties such as slope, vegetation, risk etc.
Based on slope and non-vegetation, the risk potential for every cell is calculated and given a value between 0 and 1, as described in the procedure. With the risk for every cell known, the total risk for every basin is calculated.
Based on the basin ID, the lowest basin cell is found, and the downstream cells from this point make out a potential runout zone. The runout zone adjacent to the road delineates the possible impact area of the upstream basin, and the road segment is assigned a risk value based on the risk found in the upstream basin.
Structure of application

Overview
In principle, the application is divided into 4 parts:
the main class, RasterAnalysis, which runs the application, and accesses methods in
the object class Raster and
the analysis modules, FlowDirection, BasinModule, RiskModule;
the helper classes for file and keyboard handling, KeyboardInput, RWFile, FileIO, and
the visualization module, GraphicsModule, which is to ensure correct output.
* The flow direction could have been found with commercially available GIS and then used as an additional input file. However, for the learning experience, we chose to develop this class as part of the application.
The key idea behind this structure is that the application can be extended with more modules as it is developed for different hazards.
RasterAnalysis class
The RasterAnalysis class runs the application. It creates instances of the modules and classes and invokes the necessary methods in these.
KeyboardInput class
The KeyboardInput class is essentially a helper class designed to facilitate keyboard input at the designated screen prompts. It accepts double precision, floating point, integer values and String as its input.
RWFile class
The RWFile class is a helper class that reads from and writes to a tab-delimited text file. The methods in this class convert a raster surface from a tab-delimited text file to/from a Raster object that is used in the analysis.
FileIO class
The FileIO class is similar to the RWFile class in that it reads from a text file. In this case, it is simply designed to read lines of text from an ASCII text file. This class was created to help display instructions and other information by reading it from separate text files rather than envoking it using System.out.print() within the other classes.
Raster class
The Raster class is the primary object in this application and represents the raster surface that is to be analyzed. The class contains methods for getting and setting data at a) a given cell ID, or b) a given row and column. In doing so the class also contains methods for converting a cell ID to a row-column position. In addition there are methods for setting and getting the raster dimension, which is the number of rows and columns in the raster.
FlowDirection class
The FlowDirection class takes a DEM Raster as input object and creates a Flowdirection Raster object as output. This Raster object is then later used to find upstream cells from any given cell.
BasinModule class
The BasinModule class is what this application was all about initially, videlicet delineating the basins along a road that may or may not be prone to avalanches. The basin is represented by an object of type ArrayList that contains the Cell IDs for each cell in the basin, which are then aggregated into a second ArrayList containing all basins with all individual cell IDs. This class not only contains methods for finding the basins, but also other basin related procedures, such as converting the basin(s) from ArrayList to Raster for output to a text file.
RiskModule class
The RiskModule class contains methods for handling risk-related procedures, such as converting slope values to risk values, masking out non-vegetated cells, and finally, a method for populating a Raster object with the basin cells that are associated with risk pertaining to slope and non-vegetation.
GraphicsModule class
The GraphicsModule class is not so much an analysis class, but rather a helper class designed to convert the Raster, TreeMap and ArrayList objects gained from the analysis into text files that can be imported into a GIS for visualization.
How to use the application
Input
As mentioned above, the following input is required as tab or comma delimited text files:
1) DEM surface,
2) slope surface *
3) road line or buffer edge, and
4) non-vegetated areas.
* The slope surface can easily be derived within the application, but is in this case found via commercially available GIS.
Remember that every cell in the surface is assigned a unique identifier. By our convention, this is done by counting from top left to bottom right, row by row, with 1 as the first cell ID. This cell ID makes it easy to relate cell positions in different surfaces to each other.
You may want to keep these text files in separate directories. Currently both input and output are kept in the same directory. It is not difficult, however, to assign a different directory to input and output simply by changing the working directory statements in the RasterAnalysis and GraphicsModule classes.
The raster surfaces are straight-forward tab-delimited text files, with no header information, where each row in the surface translates to one line in the text file. On import into the application these text files are converted to Raster objects, containing a 2-dimensional array [ ] [ ].
Working directory and file naming
Currently, the application is adapted to fit the directory structure on the programmer’s university network and home PC. Change this to fit your needs. You will also need to change the text file names in the RasterAnalysis and GraphicsModule classes.
Screen output
As it is, only minimal information is given as screen prompts. The Java code does contain a number of System.out.print() statements that have been “commented out”. Most of these whese were statements used for controlling that the application worked as intended and may be made visible again if desired.
Future improvements
Data Structure
The application is a bottom-up creation, and thus, the data structure evolved along with the application and may not be the most efficient. Some benefits may be gained from reassessing the utility classes used which then may eliminate some of the conversion methods in the analysis and visualization classes. An overall revision of the process may also lead to an elimination and merger of some classes.
Workflow
As modules were added on, this increased the back-and-forth interaction between the individual classes and methods. An overall revision may lead to an elimination and merger of some classes.
User interface
Currently, only minimal information is given as screen prompts, because the main aim of the application was developing a functional application that suited the understanding and needs of the analyst. If the application is to have a commercial value, the development of a user interface, either as simple command prompts or the embedding the application with a windows framework, would add considerable value. Some effort has been made though in that the FileIO class allows for reading text onto the screen where necessary. Adding more information in this manner can provide a first step at making the application more user-friendly.

![]()
Java documentation
View the Javadoc documentation here
Useful literature
Java books that have helped me:
- Beginning Java 2 – JDK 1.3 edition, Ivor Horton, Wrox Press
- Java 2 – The complete reference, Herb Schildt, McGraw-Hill Professional Publishing
- Java 2 – How to program 4th edition, Harvey Deitel, Paul Deitel, Prentice Hall
Related
- husdal.com: Analyzing hazards to transportation lifelines