 Network analysis in GIS is often related to finding solutions to transportation problems. In a GIS the real world is represented by either one of two spatial models, vector-based, or raster-based. Real world networks, such as a road system, must be modelled appropriately to fit into the different spatial models. Even though the models differ, the solution to different transportation problems in either raster or vector GIS uses the same path finding algorithms. Whether raster or vector GIS is to be preferred is more a question of choice than of accuracy.
Introduction
In general, a network is a system of interconnected linear features through which resources are transported or communication is achieved. The network data model is an abstract representation of the components and characteristics of real-world network systems. One major application of network analysis is found in transportation planning, where the issue might be to find paths corresponding to certain criteria, like finding the shortest or least cost path between two or more locations, or to find all locations within a given travel cost from a specified origin. Traditionally, a GIS, represents the real world in either one of two spatial models, vector-based, i.e. points, lines and polygons, or raster-based, i.e. cells of a continuous grid surface. This study will investigate the subject of network analysis in both raster and vector GIS, in order to compare the two spatial models. It will discuss their limitations and advantages, by using a road network as an example.
Network modeling in general
A network model can be defined as a line graph, which is composed of links representing linear channels of flow and nodes representing their connections (Lupien et al.,1987). In other words, a network takes the form of edges (or arcs) connecting pairs of nodes (or vertices). Nodes can be junctions and edges can be segments of a road or a pipeline. For a network to function as a real-world model, an edge will have to be associated with a direction and with a measure of impedance, determining the resistance or travel cost along the network.

Typical network graph and table structure, listing nodes, connectivity of edges, turn impedance and edge attribute data.
Since networks utilize the basic arc-node structure, by definition, due to the way the data is stored, the vector network will already have a topological structure, relating all elements. All that is needed, simply speaking, is to implement the resistance factors in the attribute tables for the lines or nodes. Directions are an explicit part of the vector network topology. If the directions are derived from digitising a road map, or received as a ready coded network form a data supplier, they may not correspond with the real-world directions and need to be checked. Consequently, the representation of network elements requires substantial amount of time to be devoted to data preparation and validation. This can be quite complex, depending on the amount of travel cost information we want to incorporate in the model: road width, speed limit, road class, delay at traffic lights, delays in taking turns at crossroads, to mention just a few. For a “simple” crossroads with four edges and one node there are as many as 16 possible turns, three directions from each edge to other edges, plus four 180-degree U-turns. In a mixed rural/urban road network in an average Norwegian municipality, with 7000 edges and nodes, there can be as many as 18000 turn possibilities (Husdal, 1998). Arcs usually describe the centreline of a network feature, such as a road centreline. Arcs and nodes are discretely referenced by coordinates. Alsolines that cross, but not intersect, can be directly implemented in the vector model, much like in the real world, where we have “overpasses” and “underpasses”.
Network modeling in vector GIS
Arcs and nodes, together with the special-purpose network elements stops, centers and turns, form the network model in vector GIS. Stops can be delivery or pick-up points along a route, centers are used for allocating services and investigating catchment areas, turns arte used in determining direction and flow within the network. The characteristics of any system being modeled in a network must be abstracted into a form that may be represented by one of these elements. Path finding in vector GIS Dolan et al (1993), Chou (1993) and Jones (1998) have described the process of finding a criteria-determined path through a network in great detail. Path finding algorithms fall into one of two main categories, matrix algorithms and tree-building algorithms, of which the latter one is the one mostly used in GIS. Matrix algorithms find the shortest distance between all pairs of nodes in iterative steps, eliminating the least favorable nodes, as seen in Chou (1993). This is based on that it is possible to represent the network as a matrix. Tree-building algorithms find the shortest path from an origin node to all other nodes, producing a tree of shortest paths with branches emanating from the origin. (Lombard et al., 1993). The most commonly used tree-building procedure is that originally developed by Dijkstra (1959), of which to date many modifications and improvements have been made for specific applications. In order to find a path, the algorithm will build a tree data structure that represents specific paths through the network. This is often referred to as a breadth-first search, that fans out to as many nodes as possible before penetrating deeper into the tree (Dolan, 1993). Starting from one origin node, the search tree builds branches in all directions, adds up the resistance figures, and keeps only those that represent the cumulative least cost. For each new set of adjacent nodes the calculations for all possible edges towards these nodes are repeated till all nodes and edges have been utilized, and the final destination is reached with minimal cost. During the process, edges may appear in the search tree and then disappear as the calculations discard their value.
Network modeling in raster GIS

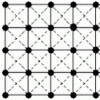
Locations defined as nodes in a network, made up by grid lines.
Raster network modeling takes a completely different approach to the topological linked vector model. First, the grid cells only approximate the exact shapes of the lines in the network. Secondly, direction is not explicitly given as in the vector model. Thirdly, the line and node attributes must be stored as a separate layer for each attribute. As a result, a network using a raster model normally consists of a vast number of layers. Even if it does not appear so explicitly, a grid is in fact a graph representing a network, with 8 possible directions from each node. Since the grid has a given resolution, the cells will only approximate the exact shapes of the network.
Path finding in raster GIS
The pathfinding algorithm in raster is similar to the algorithm in vector grid. In order to find a least-cost path one must first derive an accumulated cost surface, associated with cost or impedance of crossing the surface from cell to cell. To derive the cost surface one would have to interlace and combine the various grids describing various attributes. Fairly complex, but given the map algebra inherent in raster GIS, the computation itself is then straightforward. In terms of map algebra, Tomlin (1990) describes the the process of moving from origin to destination as a “spreading” function, using waves and refraction as analogy, an approach that is also supported by Douglas (1994).
Note to my readers: This course paper is what eventually led me to my thesis for my MSc in GIS, where I used raster GIS for network analysis, using the software mentioned below. Read more here: Making a straight line square. You may also be interested in reading a historical summary of various approaches to delineating a corridor on a surface: Corridor analysis- A timeline of evolutional development.
Practically speaking, a raster GIS software (e.g. MFworks) will compute the least path as follows: The spread function employs the cost surface to calculate the cost of passing from the origin outward towards the destination and assigns the accumulated value to each cell that is passed. Then, the reverse is done, going from destination to origin. Adding the two accumulated together yields the least-cost path.

Finding best path in raster GIS (using MFworks). Left, calculating path from origin to destination. Middle, backpath from destination to origin. Right, result of adding the two paths, best path is shown in black.
A raster network is planar, since the grid represents one continuous surface. To model multi-planar lines one would have to construct several layers with lines that are cut off where there in vector are underpasses and overpasses. For example, to model an underpass, we would need one overpass network layer with the underpassing line cut off at the overpass, and one underpass network layer with the overpassing line cut off at the underpass. Modelling directions in a raster network is possible, though not as easy as in vector. A slope value can be seen a value of direction. As long as neighbouring cells have the same slope, movement is allowed, on encountering a cell with opposite slope, entry in that direction is restricted or prohibited. Modelling specific turns at crossroads can be done in the same way. However, one would have to create numerous layers corresponding to the number of turn options and flow directions. In conjunction with this, it is also necessary to have layers describing the cost or resistance of making the turn.
Comparison study
In general, depending on the grid resolution, raster and vector networks are capable of performing the same spatial operations and analyses. In both cases the flow of movement, either from node to node in a network, or from cell to neighbouring cell of a raster, is subject to resistance, determining the direction and speed of flow. The way this resistance is modelled differs from vector to raster. Using vector, it is easier to import the attribute data of a given network in from an external database, which is where the data often would be stored in real life. Directions over a raster network cannot be carried out without first deriving the topology from the surface properties, whereas directions are an explicit part of the vector topology, even when they need to be corrected and validated in the modelling process. The vector model can hold discrete entities, for instance keep the exact length of an arc as arc attribute, while the raster model only will approximate this, depending on the grid resolution. Neighbouring lines in raster will have to assume the minimum resolution distance of say 10, 20 or 50m, whatever the cell size is. In vector, due to coordinate referencing, there is virtually no limit as to how close lines can be or how many that can be incorporated in the network. Computations are very much based on the same principles. Even though a vector model can be fairly complex, the complexity is more or less limited to the attribute table(s). It does not, like in raster, constitute a large number of interwoven layers.
Conclusion
The vector data model is feature oriented, as it represents space as a series of discrete entities, which are geographically referenced by Cartesian coordinates. The raster model is location oriented, where each cell is part of a tessellated continuous surface that describes a given attribute. Since a network is based much more on the interaction of its component entities than it is based on its component locations, the vector model intuitively seems more appropriate for any kind of network. Based on this investigation it is possible to make two distinct observations: A vector-based network model is likely to be more suitable than a raster model for analysing precisely defined paths, such as roads and rivers or drainage canals, i.e. discrete entities that derive mainly from the built environment, and where attributes play a major role in determining the network. A raster-based network model, on the other hand, seems to be more fit, when the problem is concerned with finding a path across terrain that does not have predefined paths, and where the network does not consist of many attribute layers and artificial directional constraints, because that will make the modelling process more complex. The key to producing successful network models is in understanding the relationship between the characteristics of physical network systems and the representation of those characteristics by the elements of the network model. In vector and raster, the efficiency and validity of the network depends on how precisely the network can be modelled to match the real-world network it represents. Thus, it makes no difference whether vector or raster is used. What matters, is that the model used is appropriate to the task in question.
References
Burrough, P.A. and McDonell, R.A. (1998) Principles of Geographic Information Systems, Ch.7, pp.180-181
Chou, Y.H. (1997) Exploring Spatial Analysis in Geographic Information Systems, Ch.7, pp. 215-264
Dolan, A. and Aldous, J. (1993) Introduction to Networks and Algorithms, Ch. 7, Ch. 8, Ch 18
Douglas, D.H. (1994) Least-cost Path in GIS Using an Accumulated Cost Surface and Slopelines, Cartographica, vol.31, no. 3, pp. 37-51
Husdal, J., Sandvik, A. and Klingsheim, A. (1998), PloGIS – et verktøy i forvaltning av bilpark og planlegging av kjørerute (Norwegian, English: PloGIS – a tool in car pool management and route planning), Coursework submitted in fulfillment of the one-year undergraduate study in GIS, Telemark College, Norway
Jones, C. (1998) Geographical Information Systems and Computer Cartography, Ch. 13, pp. 225-230
Laurini, R. and Thompson, D. (1992) Fundamentals of Spatial Information Systems, Ch. 5, pp.175-197 and Ch. 8, pp. 310-312
Lombard, K. and Church, R.L. (1993) The Gateway Shortest Path Problem: Generating Alternative Routes for a Corridor Routing Problem, Geographical Systems, vol. 1, pp. 25-45
Lupien, A.E., Moreland, W.H. and Dangermond, J. (1987). Network analysis in geographic information systems. Photogrammetric Engineering and Remote Sensing, vol. 53, no. 10, pp.1417-1421
Mainguenaud, M. (1995) Modelling the network component of geographical information systems, International Journal of Geographical Information Systems, vol. 9, no. 6, pp. 575-593
Van Eck, J.R. and De Jong, T. (1990), Adapting datastructures and algorithms for faster transport network computations, Proceedings of the 4th int. symposium on spatial data handling, vol.1, pp. 295-304
Zhan, F. B. (1997) Three Fastest Shortest Path Algorithms on Real Road Networks: Data Structures and Procedures, Journal of Geographic Information and Decision Analysis, vol.1, no.1, pp. 69-82
Thinkspace Inc./ MFworks (1999) How do I Find the Cheapest Route, excerpt from the MFworks’ Help Menu
Zhou Q., Yang X. and Melville M. D. (1996) A GIS Network Model for Sugarcane Field Drainage Simulation, in Proceedings of 8th Australasian Remote Sensing Conference, 25-29 March, Canberra, Vol. 2, pp 366-372.
Reference
Husdal, J (1999) Network analysis – network versus vector – A comparison study. Unpublished course paper for the MSc in GIS. University of Leicester, UK.
Related
- husdal.com: How to make a straight line square
- husdal.com: How to use MFworks for network analysis
- husdal.com: Corridor analysis – a timeline of evolutionary development